
Highlight Photo
Developing Sensors for Diagnostics and Monitoring of Clincially Relevant Samples
Figure 2. Emission spectra profiles
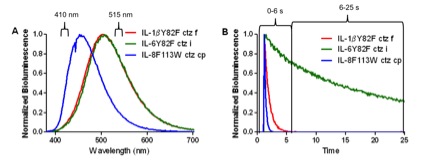
The emission spectra profiles of the three interleukin-aequorin fusion proteins with the respective ctz’s combinations selected for the study. All measurements were performed in triplicate with the mean response plotted and normalized with the maximal intensity assigned the value of 1. B. The emission decay kinetics of the three fusion protein/ ctz combinations. All points are the mean of three replicates. The response was again normalized with respect to the maximal intensity which was made equal to 1.
Credits: Daniel Scott and Sylvia Daunert