
Highlight Photo
Discovering how to create appropriate cell-matrix interactions for improving tendon repair
Figure 1b.
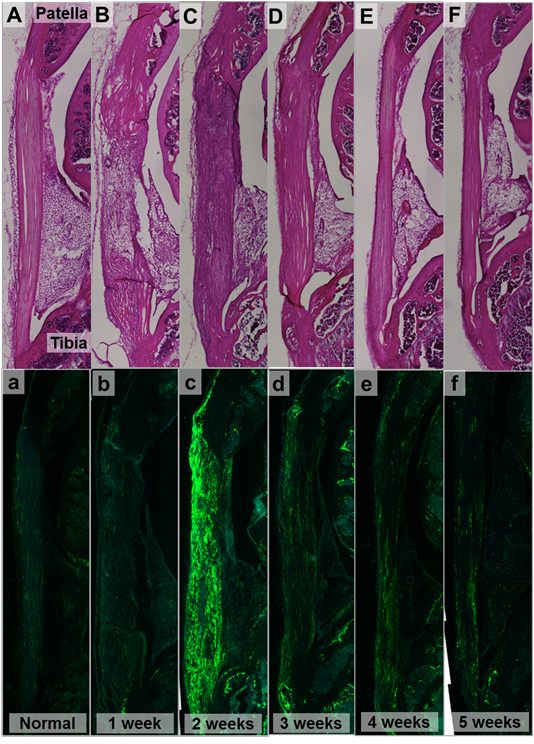
H&E (A-F) and Col1-GFPtpz/Col2-ECFP (a-f) micrographs from serial sagittal sections from Normal Patellar Tendon (A,a) and the defect region at one (B,b), two (C,c), three (D,d), four (E,e) and five (F,f) weeks of healing. 152×203mm (600 × 600 DPI). Note the dramatic increase in Collagen 1 gene expression at two weeks after injury. Adapted from Reference 2. Training includes NSF IGERT #0333377.
Credits: David Butler