

Highlight Photo
Nanocrystal-based solar cells and scanning optical microscopy
Local performance-related characterization of CIGS nanocrystal-based solar cells using LBIC microscopy
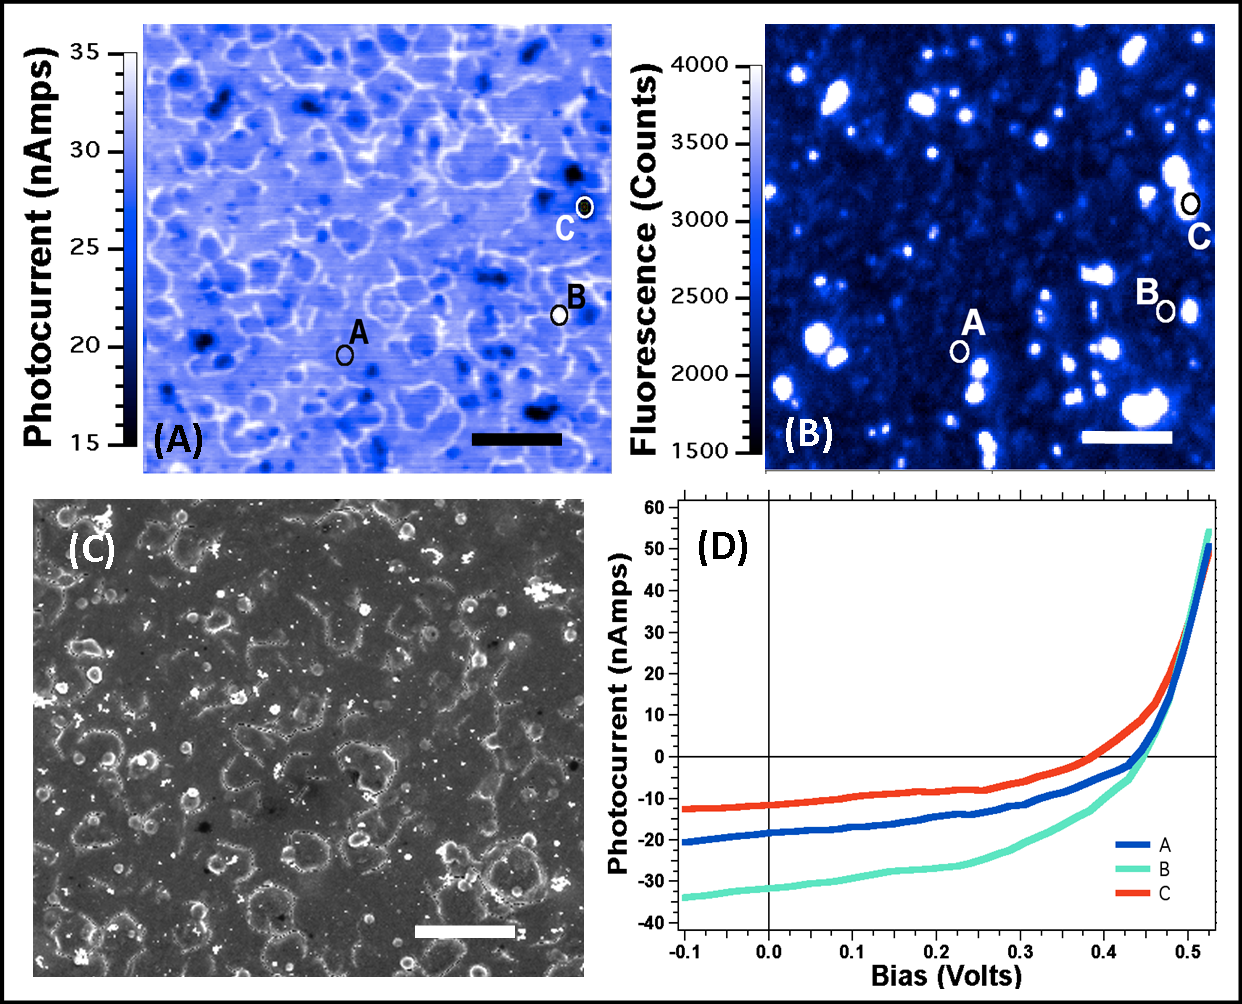
Figure 2: Photocurrent (A) and fluorescence (B) maps of a CIGS nanocrystal-based solar cell as measured using the LBIC microcopy technique and a beam of light with a 250 nanometer spot size. © Scanning electron microscopy (SEM) image of that same solar cell that shows that the high-photocurrent channel-like regions in the photocurrent map correspond to very small cracks that formed due to the drying of the CIGS nanocrystal-based ink. (D) Local current-voltage curves of regions marked A, B, and C on (A) and (B). All scale bars are 10 micrometers.
Credits: Micah Glaz, Dave Ostrowski, Brian Goodfellow