
Highlight Photo
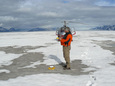
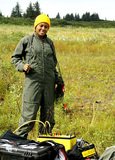
Bering Glacier Project
Resistivity Survey Results
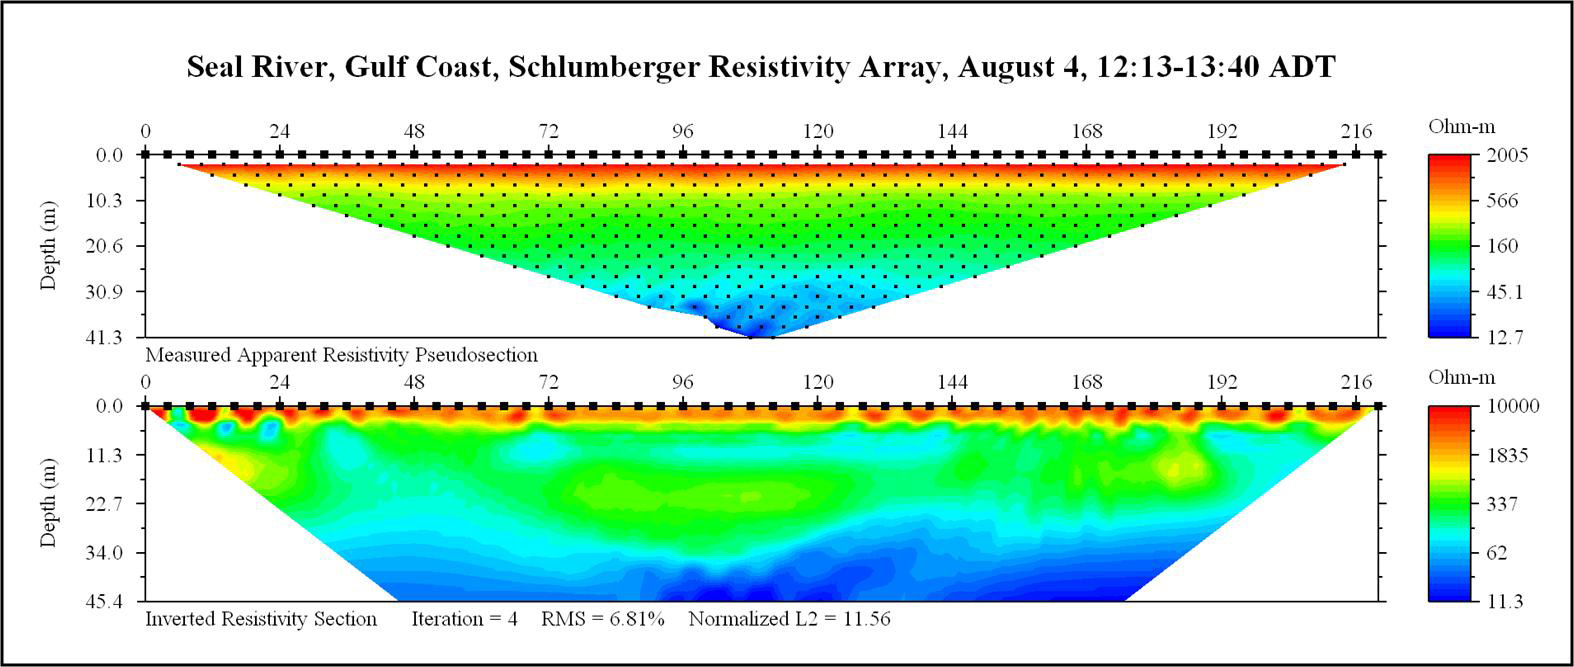
Example resistivity survey results (top graph: Measured Apparent Resistivity Pseudosection) from a 330-m Schlumberger array, 6-m electrode spacing (horizontal axis), and corresponding data inversion (bottom graph: Inverted Resistivity Section). The deepest blue color represents the lowest resistivity zone corresponding to the presence of saline water. The red color is the highest resistance, which is the relatively dry near surface soils. The green zone is fresh water. This survey was conducted near the seashore at the mouth of the Seal River.
Credits: evin Endsley and Silvia Espino, Michigan Tech