
Highlight
Bering Glacier Project
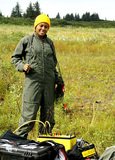
BLM co-camp director Christopher Noyles
Achievement/Results
The uncertainties surrounding the measurement and spatial averaging of global surface temperatures is a critical issue fueling the controversy over the rate of global climate change. Changes in the volume of the world’s ice caps and glaciers provide a broad, long-term approach to monitoring climate change effects. Despite the fact that melting snow and ice are reliable indicators of warming, quantifying the amount of melting is subject to uncertainties as well. In an attempt to reduce the uncertainties, scientists use complementary, independent measures of changes in ice volumes and other related conditions. The Bureau of Land Management manages a field camp near the terminus of the Bering Glacier, which is North America’s largest glacier. The BLM facilitates interdisciplinary groups working on complementary research related to glacial processes. As a result of the SF IGERT, students and faculty from Michigan Tech and Southern University—Baton Rouge participated in multifaceted research on and around the Bering Glacier during the summer of 2007, as guest collaborators with scientists from the Michigan Tech Research Institute (MTRI) and BLM staff and other universities. The SUBR team led an effort to digitally map the geometry of the glacier terminus, both the lateral extent and the surface elevation, using a high-precision RedHen Global Position System while flying at low elevation in a helicopter. The Southern University Bering Glacier Research Team produced an aerial map of the extent glacier retreated from 2006 to 2007. The Bering Glacier retreated an average of 0.5 km during this 1-year period. Moreover, it was discovered that this retreat contributes directly to freshwater released from by the Bering Glacier daily into the Pacific Ocean through the Gulf of Alaska. Researchers from MTRI use ablation meters and satellite imagery to monitor changes in glacier volume. The glacial melt water and broken ice first enter Vitus Lake, which is separated from the Gulf of Alaska by a terminal moraine, which is a land feature formed decades to centuries earlier from rock and soil debris deposited from the melting glacier. The width of the moraine varies from 3 to almost 10 km, and separates Vitus Lake from the Gulf of Alaska. Lake Vitus overflows through the Seal River, into the Gulf. Water budget analysis by MTRI researchers have shown that the overflow does not account for all of the glacier melt water. Of course some evaporates, but most of the melt water must flow underground, through the moraine, into the Gulf. The amount of subterranean flow is unknown. The Michigan Tech team led the effort to use geophysical surveys to map the lake-supplied freshwater aquifer that flows towards the ocean, in the first attempt to characterize how much subsurface flow contributes to the hydrology resulting from the melting glacier. Michigan Tech students and their faculty advisor used electrical soundings to determine the depths to the freshwater aquifer and the underlying seawater that intrudes from the Gulf. They were able to show conclusively that the freshwater is reaching the Gulf through the subsurface flow, starting as a layer over 60-m thick at the lakeshore and discharging into the ocean through a 30-m thick layer at the seashore. Seawater is apparently intruding all the way to the lake, based on water quality studies by MTRI, but due to a lack of depth penetration, the intrusion this far inland was not observed during the Michigan Tech geophysical surveys in 2007.
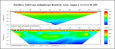
Mykel Delandro, a junior mechanical engineering at SUBR, assisting Michigan Tech students Silvia Espino and Kevin Endsley, both juniors in applied geophysics, with performing an electrical resistivity survey near Midtimber Lake, between Vitus Lake (a freshwater body formed from the melt water from the Bering Glacier) and the Gulf of Alaska. The attached graphic image provides example resistivity survey results (top graph: Measured Apparent Resistivity Pseudosection) from a 330-m Schlumberger array, 6-m electrode spacing (horizontal axis), and corresponding data inversion (bottom graph: Inverted Resistivity Section). The deepest blue color represents the lowest resistivity zone corresponding to the presence of saline water. The red color is the highest resistance, which is the relatively dry near surface soils. The green zone is fresh water. This survey was conducted near the seashore at the mouth of the Seal River.
Address Goals
Collectively, the different research groups involved with this research contribute independent measures of glacier retreat, melting, and melt water fluxes, which not only provides information that can be used to quantify global change effects for this particular region, but also demonstrate the applicability of field methods that can be applied at other locations for future monitoring activities which will help us to better understand the impacts of global warming on glacier hydrology. Due to the remote location of the BLM BGFC, researchers often participate in each other’s field activities. Some of the SUBR team joined the Michigan Tech group in the geophysical surveys and provided GPS support in determining the survey locations and elevation profiles. The MTU group learned how to perform the high-precision GPS surveys, some of which were performed in conjunction with other MTU field activities that required helicopter transport. In addition to working together in research activities, the participants lived together in rustic accommodations under harsh environmental conditions. Not only did the participants come from widely different locations, but also from quite different disciplinary backgrounds, and the camp setting required each participant to explain what they learned and why it is important to each other, every evening in a recap of the day’s activities. The SF IGERT was key in putting these groups together, and MTRI provided the impetus and initiative to facilitate this opportunity at a truly unique location under the auspices of the BLM.