
Highlight Photo
Single Particle Tracking on Live Cells
High density single particle tracking.
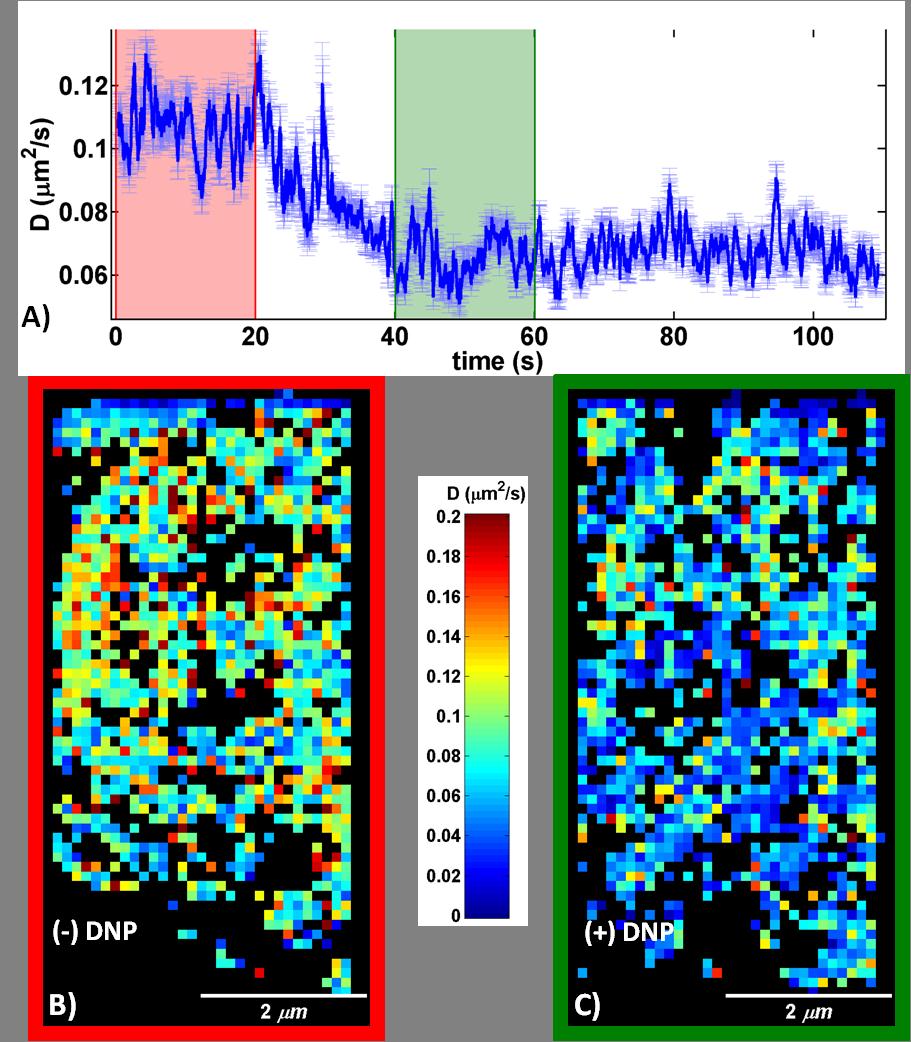
A) Instantaneous diffusion for SPT experiment with an acquisition rate of ~30 fps of QD-IgE (1 ug/ml DNP-BSA added ~20 seconds into the acquisition). Error bars represent the standard deviation in the estimated diffusion coefficient as approximated using the Cramer Rao Lower Bound. B) and C) spatial maps of diffusion coefficients (estimated diffusion coefficient for each spatial bin is defined by the color scheme indicated in the colorbar; red faster, blue slower, black no sampling) for the same experiment shown in A) estimated using all squared displacements observed between 0-20 seconds (red box) and 40-60 seconds (green box). A maximum likelihood estimator is used to estimate the diffusion coefficient.
Credits: Patrick Cutler – University of New Mexico