
Highlight Photo
Lateral bank erosion in bedrock streams
Lateral Bank Erosion
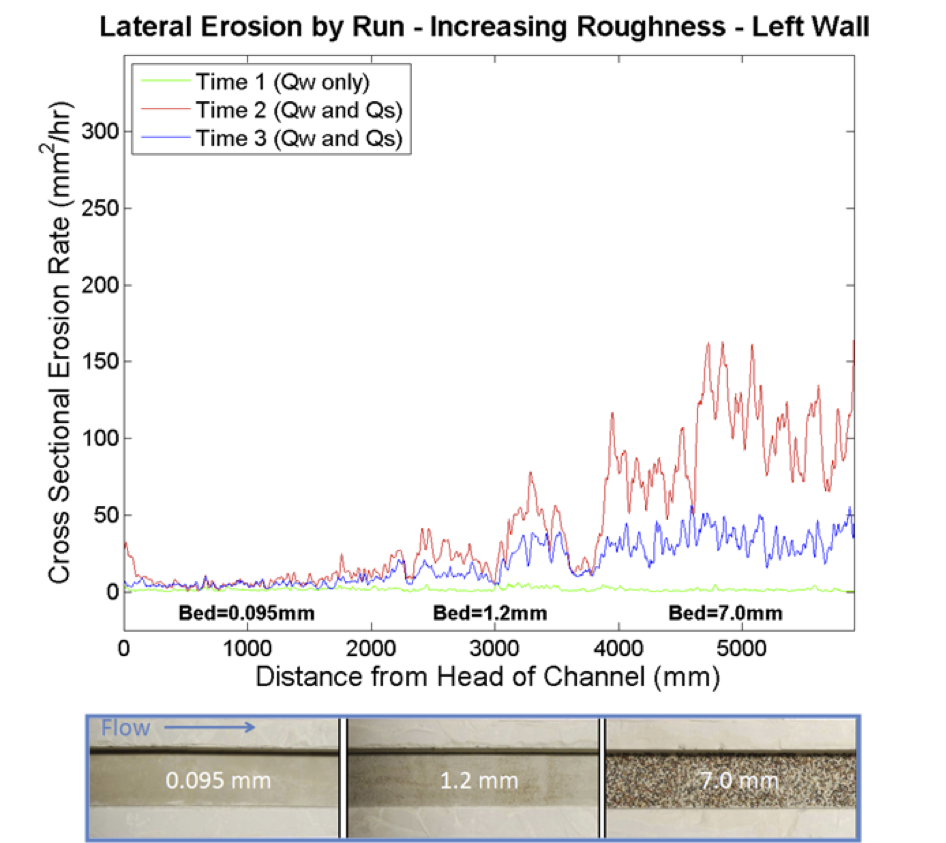
Fig 1: Longitudinal profile of lateral bank erosion. Lateral bank erosion for each measured cross section is plotted on the y-axis as a function of downstream distance. The green line is lateral erosion from clear water flow without bedload sediment. The blue line is lateral erosion during the first time period in which bedload sediment was introduced to the experimental channel. The red line is lateral erosion during the second time period in which bedload sediment was introduced. Note the change in bed roughness downstream as indicated by labels on the data plot as well as the overhead image of the experimental channel. The rate of lateral erosion in the roughest section (Bed = 7.0mm) is roughly an order of magnitude greater than the rate of lateral erosion in the smoothest section (Bed = 0.095mm).
Credits: Ted Fuller