

Highlight Photo
Flow Anomaly: Informatics Approaches to Localize Pollution Sources
Figure 1. An example of a flow anomaly in a river network
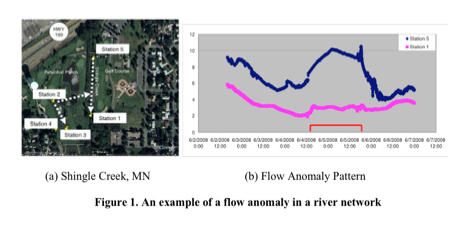
At Shingle Creek, there contains five water quality sensors (Figure 1a); two located within the creek (Stations 5 and 1) and three located in neighboring ponds (Stations 2, 3, and 4). The dotted lines depict the direction of flow between stations. The largest flow anomaly (i.e., longest time period) started to occur on June 4, 2008 at 1:06pm and ended on June 5 at 7:34pm (denoted by the red box in Figure 1b). Based on this flow anomaly, the upstream station 5 gave a high value of dissolved oxygen, whereas the downstream station 1 had a low value.
Credits: J. M. Kang, S. Shekhar, C. Wennen, P. Novak, W, Arnold
