
Highlight Photo
Ups and Downs of Visual Cortex
Statistical model reveals sharper tuning curves
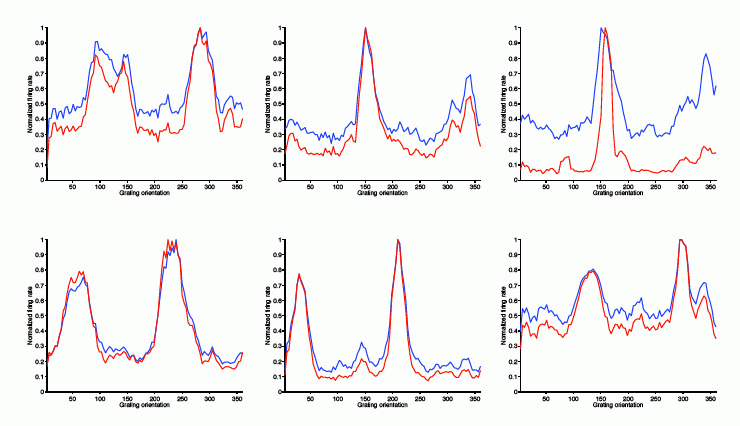
Orientation tuning curves of six neurons recorded from primary visual cortex of a macaque monkey looking at a drifting grating stimulus. The blue curves show orientation tuning calculated in the classical way; the sharper red curves were calculated by using the statistical model to subtract out network state effects, leaving stimulus-dependent firing.
Credits: Ryan Kelly and Tai Sing Lee, Carnegie Mellon University