
Highlight Photo
Highly Variable Sediment Oxygen Uptake Rate
Figure 1
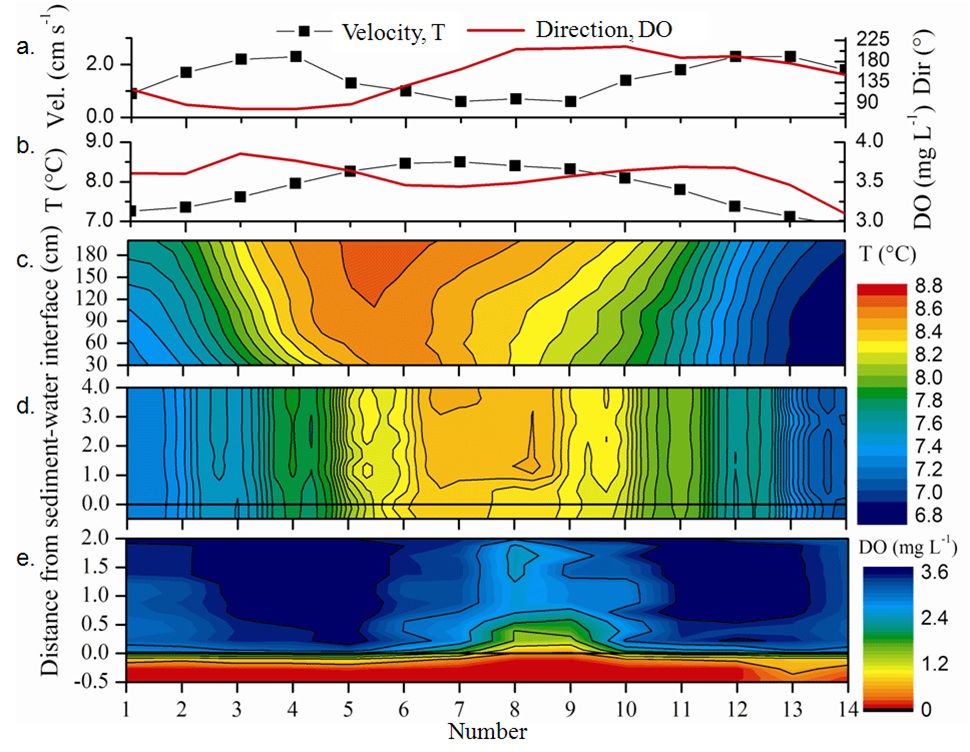
Velocity, temperature and dissolved oxygen (DO) data obtained during August 27 – 28, 2008 in Lake Alpnach, Switzerland. Time (x-axis) shows 14 data sets obtained (sub-hourly) during the 12-h campaign. A decrease in DO and increase in temperature is observed across the sediment-water interface during the period of low current velocity (profiles 8 – 9).
- Panel a.: Time series of current velocity magnitude and direction at 10 cm above sediment.
- Panel b.: Temperature and DO time series at 8 cm above sediment.
- Panel c.: Temperature contour plot showing data from 30 cm to 200 cm above sediment.
- Panel d.: Temperature contour plot showing data from -0.5 cm (in sediment) up to 4 cm (in water column) (14 profiles obtained throughout 12-h measurement period).
- Panel e.: DO contour plot from -0.5 cm (in sediment) up to 2 cm (in water column) (14 profiles obtained throughout 12-h measurement period).
Credits: Lee Bryant